This function creates a network plot. This function also provides options for customizing network visualizations, allowing users to adjust node sizes, edge weights, and color schemes to highlight specific patterns or relationships of interest.
net_plot.RdThis function creates a network plot. This function also provides options for customizing network visualizations, allowing users to adjust node sizes, edge weights, and color schemes to highlight specific patterns or relationships of interest.
Examples
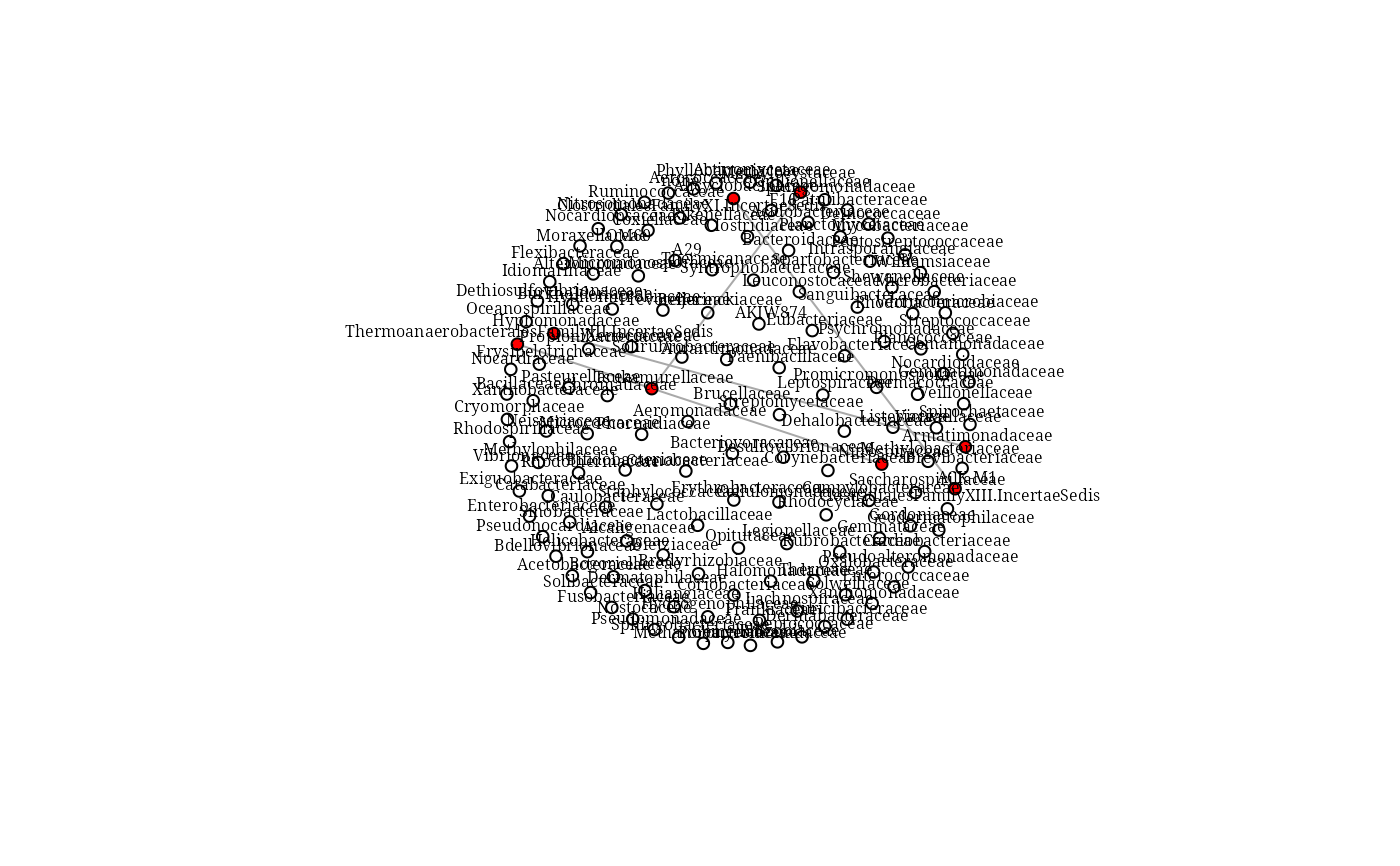
data ("ctr_g_dstool")
net_plot (ctr_g_dstool, type = "centrality")